VRTool
How To
Installing vrtool
1) Download
the software installer and save to your computer.
2) After the complete download, run the
file. This will install the software in your system.
For Windows Vista and Windows 7, you will be prompted for system administrator credentials. Admin rights are only required while installing, not for normal program usage.
3) After installing, to run the program, use Windows menu [Start]
> Applications > VRTool menu or use the
desktop icon.
Upgrading
If you already have vrtool installed
and want to update, download, run the installer program
and install in the same directory (normally
\program files\vrtool\ ).
check the download page for current version info.
Getting started
The Desktop Configuration Wizard that will guide you while configuring the program for a new regatta leg.
Use menu option File > Config Wizard. The wizard will help you choose a chart file, a polars database, specify the first mark (i.e. first destination), the leg name, boat name etc. In the end you will save that configuration to a new desktop file. Desktops are text files with extension .nav.
Every time you start the program, load that desktop file to retrieve the configuration you created for the regatta leg. To load an existing desktop use
menu option File > Open Desktop. If you are
new to the program, try the sample desktop vrtool.nav.
This will open a chart with a couple routes, tracks and marks.
You can add our own marks, design routes and tracks, add
great circle routes or use weather routing to generate
tracks and isochrones. All these objects will be saved to the desktop file.
The Tools
In the toolbar you can choose from the
following tools:
- zoom - Click left mouse button to zoom in
and right to zoom out.
- hand - Left click and drag the map.
- ruler - Use it to measure distance and course
(if the wind grid is loaded it will calculate boat
speed, track time and recommended sail, using the
polars)
- route designer - Use it to draw routes.
Right click the last point to finish and give the new route a name.
- track designer
 -
Use it to draw tracks. If winds
are loaded, the program will calculate
date/time for each point. While designing the track, when you cross a 12h intervals,
wind forecasts change automatically.
-
Use it to draw tracks. If winds
are loaded, the program will calculate
date/time for each point. While designing the track, when you cross a 12h intervals,
wind forecasts change automatically.
- marks - Use to add marks to de desktop.
Choose a name and icon for your mark.
- pointer - Use to point things in the desktop.
It will show the associated texts (mark name, track
point text, wind speed etc)
- circle - Use to draw a circle or a set of concentric circles around the clicked location.
Data files
VRtool needs data to perform calculations. Those have to be loaded in the program before you can use the track designer or the weather routing module, for example. These data files are charts, wind forecasts and polars.
Charts - vrtool uses a custom vector chart format files, with extension .CHT. The program comes with a simple world map (world3.cht). You can find more detailled files in vrtoutoulz or in the chart lib . Download and save files to the vrtool directory. To load a chart, use menu option File > Load vector chart..
tip: A good world chart is c_gshhs_i.cht (from vrtoutoulz). This is the one used by VORG 11/12 |
Wind forecasts - Those can be obtained from a number of sources. Ultimately, all wind forecasts come from the GFS ( Global Forecast System, a world weather model run by NOAA a couple times a day) but regatta game providers do some processing in NOAA data. Vrtool can use winds from:
-
Downloaded directly from NOAA - Using the vrtool NOAA import module.
-
From
vrtoutoulz website - Set regatta server to
www.vrtoutoulz.fr/winds, point any location with the mouse and press
F2. This will load a 10x10 degree wind grid.
-
Load a grid 2 format file ( from UGrib or ZGrib ).
-
From Vritual Regatta game files.
- Virtual Regatta - For VR, you can use game winds (imported by vrtool from Firefox cache) or winds from
- VORG 11/12 - Import winds directly from NOAA server (using vrtool NOAA import module) or vrtoutoulz winds.
|
After loading the wind forecasts , you may use buttons to select a given forecast .
Use buttons Ctrl-1 to Ctrl-7 or the buttons in the
toolbar  to display successive wind forecast periods.
Polars - Polars allow the calculation of the boat
speed for a given wind speed and wind angle.
Vrtool can use two kinds of polar chart databases.
-
Multi sail polars - This is a new format with a set of polar data for each sail. This is the preferred format. Multi-sail polar database files have extension XML, and can be produced, imported and edited using the vrtool polar studio.
-
Merged sail - This compact polar database format is available from sources like
vrtoutoulz. Extension .
CSV.
Select the file and click load. Also select which database type you are using in the Winds > Polars tab.
Importing game winds and boat data
You can keep boat positions and winds updated by using the Firefox cache importer for Virtual Regatta and VORG. Read more about that in this tutorial.
Set destination (the next mark position)
Set your next leg destination. This will enable
VMC readings (velocity made good to course) and Great Circle distance
calculations. To set the destination, go to the Boat
Attitude panel and click the [settings] button
in the top left of the panel. Edit latitude and longitude
of destination point, or press [point] button and click
a location in the chart with the mouse. All VMC, course and distance to destination
calculations use great circle formulas.
Leg calculator 
Use the leg calculator for great circle and rhumb
line route calculations. The leg calculator will also add the computed route to your desktop. Just specify the start and end points, by pointing in the chart or typing the coordinates (lat/lon)
Designing Tracks
Make sure you have data files loaded (winds and polars) as described.
Click the track tool button .
Click the first point of the track you are planning. Always
start a new track by clicking your current boat position.
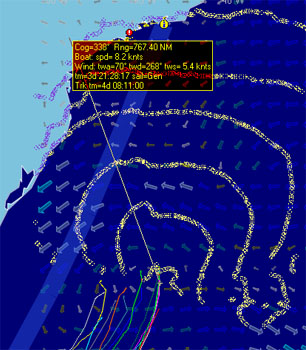
As move the mouse, track data can be viewed
in the floating cursor and in the boat attitude indicator.
Left click the mouse to add a point to the track. Use backspace key to delete (correct) the last point. As you
draw the track, point times will be calculated based on polar
charts and wind data. Appropriate
wind forecasts are selected as you go.
 |
Move slowly as you cross a 12h boundary and plot
a point right after that, so you get a peek of
the next wind before continuing.
When you stretch a new segment, any wind change
boundary (12, 24 etc) in that segment is plotted
as a little circle. If you hold the [Alt]
key pressed while moving the mouse, the boundary
keeps inprinted in the chart, building a curve
representing the points that can be reached sailing
a constant course until the next wind change. This is handy
for quickly figuring the best course to follow
next.
If you stretch a long segment and swing it, you
will quickly spot opportunities and problems ahead
(see image to the left).
You may use the arrow keys to scroll the chart.
Or hold [Ctrl] and drag the chart with
the mouse.
Holding [Shift] while moving the mouse
stretches the line in 0, 45 ,90 degree directions.
|
Right-Click the mouse to finish a track. Choose a name for it. You may change color, width , opacity and
other track properties (go to Routes/Tracks tab).
After the track is complete, use can use button
[Mark track 12h 24h..] to convert the seletced
route/ track to a new track with extra points added (or use Ctrl-T key combination). These
points are:
- Crossing wind rectangle boundaries (for virtual regatta).
- Crossing a wind forecast change time (12h, 24h,
36h etc)
These are the points where you may have
to change boat course or sail, for best performance (i.e. action points).
Note: The procedure produces a new track
over the original. Delete or hide tracks using the listbox
as needed. Track properties can be viewed and changed
in the routes/tracks Tab.
Weather routing
Route optimization number crunching. Read
more about this
here.
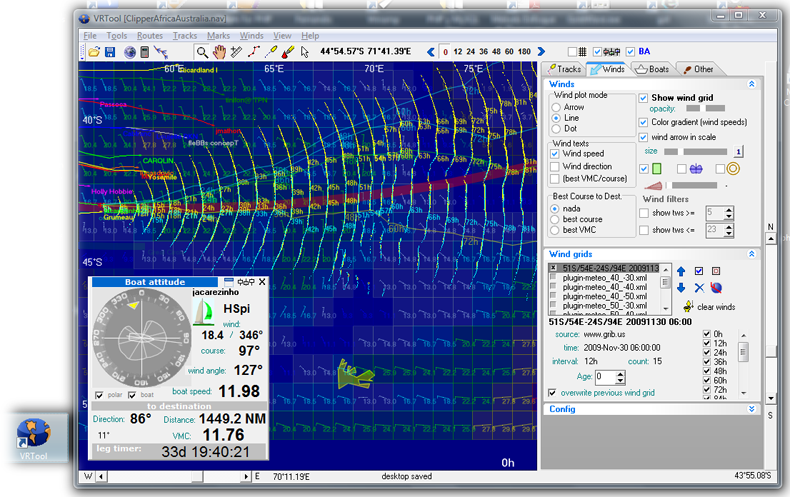
 Winds tab
|
VRTool can present winds in many different visualization
styles. Winds can be represented by arrows, lines,
lines with wind speed, wind direction and polar
lines. You can also plot Best Course to Destination
and best VMC vectors. The wind grid opacity can also be adjusted.
|
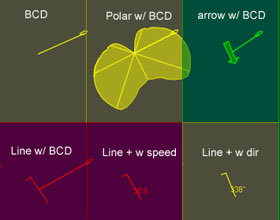
wind plot styles
|
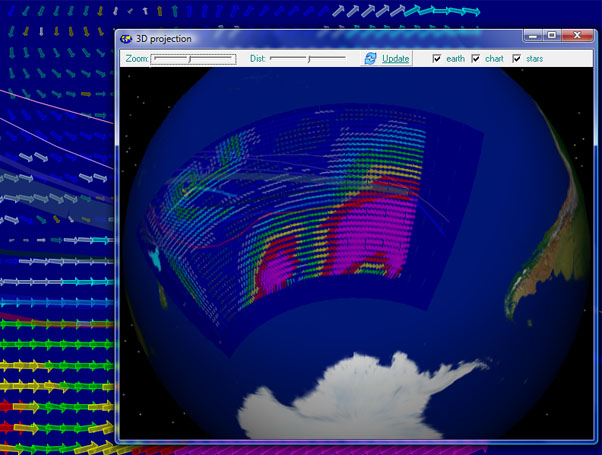
3D View
The 3D View shows a model of the Earth with
the current vrtool desktop pasted on it. It's a crude
fit (no fancy 3D boats and dolphins yet) but gives an
idea of how the flat chart relates to the spheric Earth.
VRTool projections are similar to Mercator charts.
In these projections, courses and distances are well represented,
but shortest routes are curved. By looking to the 3D projection,
you can see how routes and tracks look on the surface
of the planet.
Using the 3D View
Maximize the chart view before opening the
3D view. Adjust zoom to include the area of interest.
To open, select View > 3D View
or use the Earth button. A snapshot of the chart is taken,
chopped and pasted to the Earth model. You can rotate
the model by dragging with the mouse. Zoom in and out
with the mouse wheel and trackbars. Click Update button
to render the 3D view.
3D View
| Warning: This feature uses
OpenGL and hardware accelerated graphics.
May cause problems with older computers or simple
graphics boards. |
You will notice that there are gaps between
chart parts, particularly in wide area charts, a side
effect of the projection method.
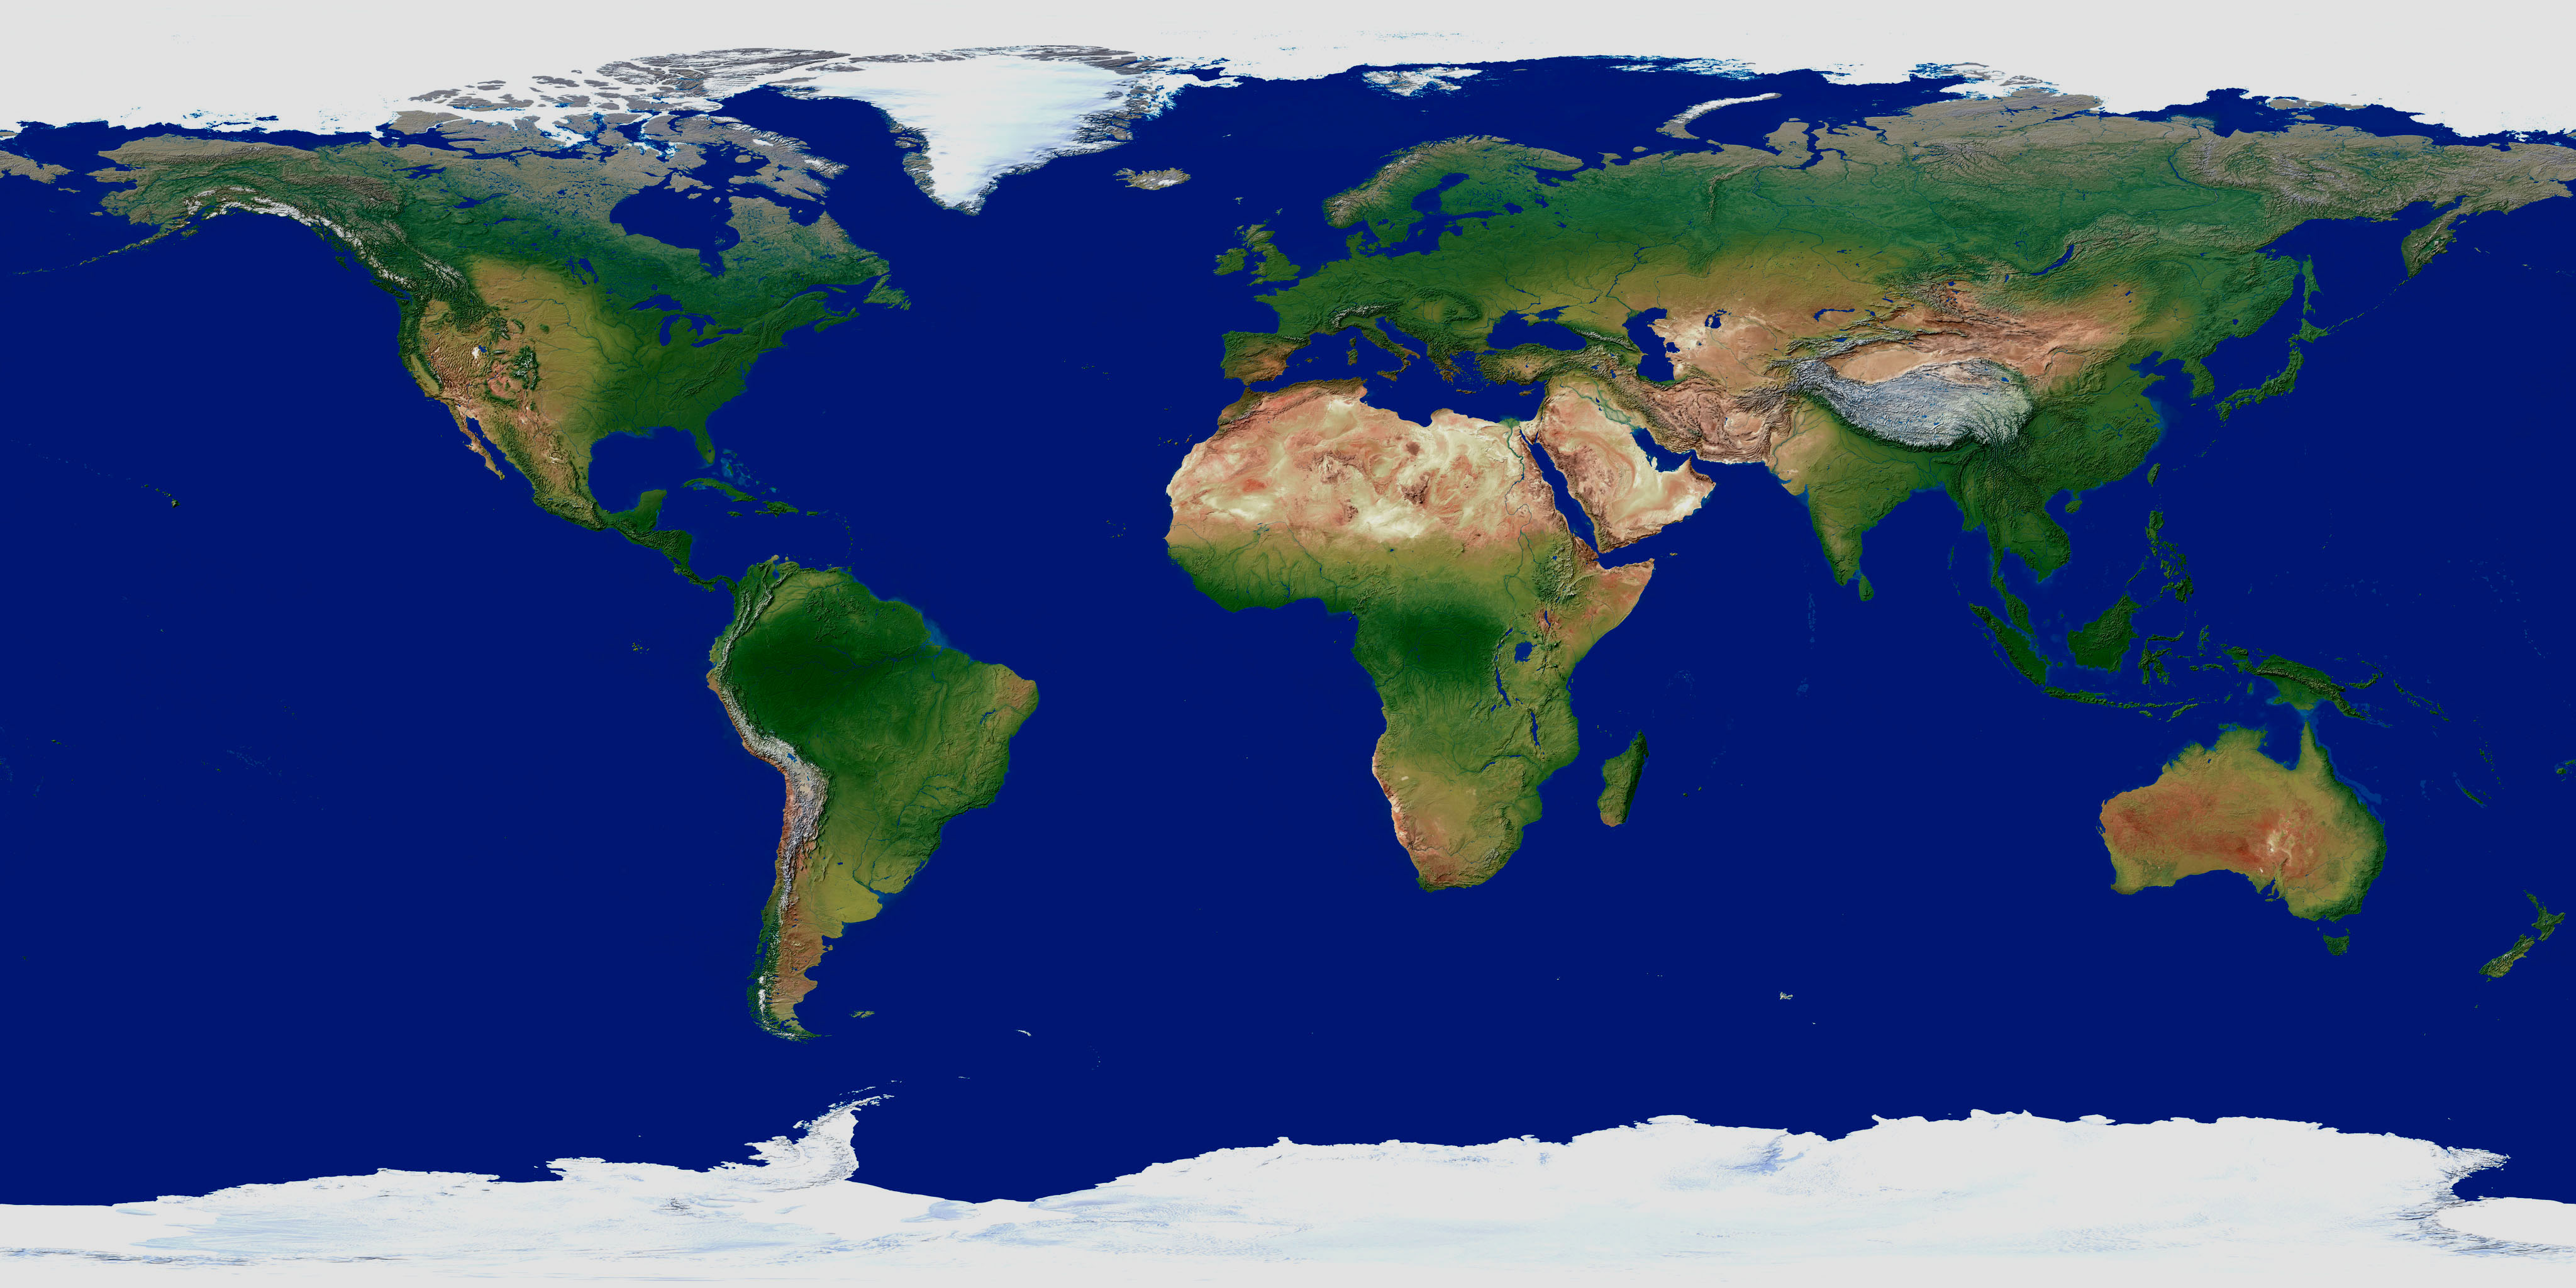
If you have a good graphics board (256 MB
or more) you may use this high res texture.
Save to vrtool directory and rename to EarthTex.jpg (backup
original texture). Restart vrtool and open 3D view.
credits: Star dome
uses Yale BSC catalog. GLScene used for
OpenGL rendering.
Earth textures by Tom Patterson (www.shadedrelief.com)
©Copr 2008-2012 Omar F. Reis